Many of our clients are getting fantastic results on the Amazon Seller Marketplace, so I created a...
In this webinar, we are going to dig deep into the Amazon Seller Central Reports to find the lessons and insights that we can learn from the volumes of data that Amazon produce and how you can use that data to make better decisions and more profits in the future.
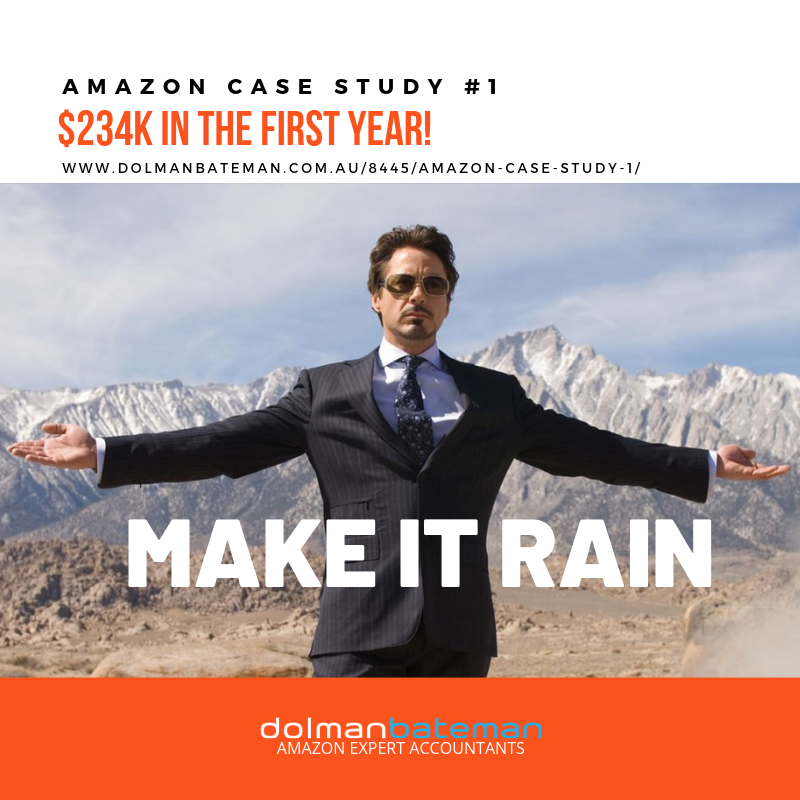
Our client, had a great first year on Amazon, but profits were not as great as expected, so we decided to dig deep into the numbers to find out why and whether the low profits were going to continue into the future.
In this webinar, we will discover:
- The primary reason why our client reached $234,000 in sales in his first year of selling on Amazon.
- How quick action over Christmas resulted in a $10,000 bonus of extra profits.
- How misreading the reason behind a fall in sales cost $2,000 in profits in one month.
- The problem with a product that is going gangbusters.
[fbcomments]
Transcription
Fantastic. Really excited to be here today. Welcome. This is the first of our new webinar series. We're going to look in detail at people's Seller Central reports and find out really what information we can get from that and how to read them and what things it tells about us. I'll show you later how you can be involved. There's some really important lessons we can learn from this particular case study and I hope you'll be able to use it to find the diamonds in your business.
Bit of background on our first case study. First year of operations, got sales of $230,000 which was fantastic achievement and something he should be very proud of. Our client, he launched four products with some variations on those and then dropped one product. The reason why he dropped that one product, we'll see later. For this case study and for all the case studies, we're referring to these products as colours just to make it anonymous. We got colours, the products of red, blue and green. Now, for businesses that got more than those products, we'll add other colours. I'm not going to tell you what the products are or what category in because, to be honest, it doesn't matter. We're just looking at the numbers and how to interpret them.
The reason we decided to look at this product line was he was expecting to make a bit more than what he actually did when we ended up doing his financials for the year. His important issue here is, one, it's important to not just leave it to the very end of the year because you can't do those changes or we can't look where things are different. We'll go through some of those things along the way. There's information in here that, along the way, he could've made different decisions on.
We've come up with, a few clients have been coming to us recently and they've said, "Okay, can you do my years’ worth of accounts." They're not in a great position where if we spoke to them six months ago, they could've done things to address it. The important issue here was whether the low level of profits was going to continue into the future and what we can learn about those decisions he made in the past with the benefit of hindsight. Could he have made better decisions? How we can use those numbers if we see similar things happening in the future, what can we change now, make it a better result. In the end, he was doing pretty well. There was a couple of accounting issues we looked at and he had the one product which resulted in some lower profits but, anyway, we'll get to that.
What we asked him to download was some business reports. These are in Seller Central. One of the difficult things about these reports is you can't get them through the APIs, which makes it slightly difficult. The first one we looked as is under business reports by date, sales and traffic. This is just all your products into one and we sorted it by month to make it easy. You can go down by day or by week. The essential columns that we wanted to get from this were the date, the sessions, the units ordered; the total order items, so the number of orders; and total ordered product sales, so it's a dollar figure; the average selling price and the unit session percentage.
We download those and open them up in Excel, but that only gave us the reports for all his products because we wanted to go down a bit deeper and see what the differences were in the other ... Whether there were some products that were doing really well, and some products that were doing badly. We then had to go in and get the products by ASIN, which is the detailed page sales and traffic reports. Again, essential columns, we wanted the date, the sessions, the units ordered. I think in Seller Central, you can select which columns you show. I think there's a little thing on the right hand side where you can select, "I want different columns to be selected". Ordered product sales, average selling price, units session percentage ... With this one, we had to select each month and then download that for each month. We've looked at for a financial from July to June. We had to go through and then put those in Excel and then start sorting them.
Let's look at the big, top level overview of the key numbers. We had sales per product. The black line is total sales and I've excluded the orange product, which was dropped, which is not really important for what we're looking at here. Since January, the sales have been growing at ten percent per month, which is fantastic and is primarily due to that blue product. We had this big jump in December over Christmas so we'll have a look at why that's happening. Just a thing to remember, sales don't just happen. They're a function. For a sale to occur you've got to have someone coming to visit your product page, which is "sessions" and I believe "sessions" is better than "page views" in terms of looking at this; and the conversion rate, which is someone's got to come to your page and they've got to accept your offer, buy your product. The conversion rate, which is the unit session percentage in the Seller Central, now we'll go over what that means and how important a number.
Sales is also a function of price so we can't just look at sales in isolation. We need to look at sessions and the conversion rate. Let's look at the sessions. I'm going to put a trend line in here, we've got total sessions. We can see that sessions have been steadily increasing. We've got a great increasing sessions along the way. I'm just wondering whether anyone can guess why the sessions have dropped in May, in particular for the blue product. Just use your question and answer section to see if we can guess why the sessions have dropped in May.
Okay, U.S. tax year. The issue was ... Exactly, ran out of stock. At this point in May we ran out of stock and we can see that the sessions have actually recovered but that line should probably have been a bit higher if he didn't run out of stock. It did return, still getting similar levels of traffic but perhaps it could have been higher if he didn't ran out of stock. The other products we've seen, we're seeing this decline in the red product in the sessions and a slight decline in the green product. That's not traveling too badly, we've got a little bump there, et cetera. We'll come back to this bump in sessions in relation to a Christmas period. The sessions have been growing at fourteen percent since January so it's a healthy level of growth.
If we look at the conversion rate, I believe the conversion rate is your most important number so in your Amazon reports, that's a unit session percentage and I've included the graph in this one for the orange product, which has dropped. The interesting thing about this graph is we've got this blue product, which is basically converting at around twenty-five percent, kind of bounces around that period so it’s around twenty-five percent. We've got the green product which is kind of settled in about the eighteen percent mark. Red's got problems. I spoke to the client about this and he said, "Yes, there is." He did have some quality control issues in relation to the red product which he's now addressed and that was part of the reason why we're getting this declining trend.
From day one, they're all pretty good conversion rates except for the orange product. It started at five, by November it increased to ten percent, got to eighteen and started to drop back. That's the primary reason why he dropped this product. It just wasn't converting and, as such, he didn't order anymore. The conversion rates on this product really, over this later period, he's selling very few. It doesn't make too much difference there. Partly, it was a seasonal product as well. It was causing, basically, drag on his cash flow so he didn't order anymore of that.
As a note, the successful clients that we've got have all got ... These ones who have increased their Amazon businesses significantly, have all got conversion rates over twenty percent. If you're not got a conversion rate at that level, that's what you need to be focusing on a regular basis. It should be your prime focus.
Let's look at the price. The price of these products, he does actually test his product pricing on a regular basis so he's always fiddling with it. You can see that, in relation to these products, red's kind of bouncing around a bit. Blue, which is a high seller, he's kind of just keeping it fairly stable level. Green, he's kind of mucking around and seeing where it relates to him. We'll look at green more in detail because there's some really interesting things that he's done in the green product that resulted in some massive profits.
The important thing is to always be kind of testing where there's market ... The markets are moving, people are coming in, people are going away. The other thing we've found is by looking at ... We've developed a spreadsheet that enables us to analyse the jungle scale data and put it into graphs. What we did is we graphed ... I think there's another video on it that we looked at the garlic press example ... Where products, within any niche, there's usually some low-priced ones and then some higher priced ones so within a niche there seems to be a band of people who are selling products at a premium price and a bunch that are selling at a discounted price and the people in the premium price don't have to sell as much and they're probably making about ten times the profit. If you have a look at our website, there'll be another example. Look for a webinar on that one where we looked at the pricing issues. Someone's asked, "What are the best ways to get your conversion rates up?" Probably not the best person to ask on that but it's something you should always be testing. There's lots of information out on improving your conversion rates, images, titles, bullet points. We'll go a bit more on that a bit later.
Gross profit, in terms of percentages, his gross profit rate's pretty good throughout most of his products. His orange product was a problem because he was basically trying to get rid of it but what we've got here is a big jump through the December period where he's taking advantage of Christmas selling and he's basically been testing his products around through this. We'll look at some of those along the way. The red one's obviously, he's kept it at a higher price but the conversions have been suffering a bit there which could be due, not so much to the price but, due to the quality control issues. The gross profit rate that he's got is kind of averaging in this twenty, thirty to forty percent rage. I should have the percentages across there. If he's got ... Which enables him to fund growth.
If you've got a really low gross profit rate, in the ten to twenty percent range, it's going to be very difficult for you to fund your growth organically. You're going to have to keep on putting more money in. His sales are growing at ten percent per month so he needs the level of gross profit to be able to fund that organically rather than having to pull in his pocket and get more money out of the mortgage or whatever it happens to be to fund the business. Each time you buy more stock, you've got to buy, effectively, he's buying, each month, you've got to buy ten percent more than last year. If you're unsure about your cash flow, I'm sure most of you would have but, go to "www.dolmanbateman.com.au/amazon" there will be a link there to our cash flow spreadsheet but stay tuned because I've got another version of that coming out which is far more detailed and far more useful.
Gross profit by product, the issue we can see here is come back to this period in December. We've got a high degree of reliance on the gross profit so he's basically getting five thousand just from the blue product and about seven and a half thousand per month in gross profit. Amazon businesses have very little other expenses, maybe a thousand dollars a month in other expenses. He is spending a bit in advertising. We've got this high degree of reliance on the profit from one product and we've got this declining trend that we're seeing from the green and red products.
Let's have a look at what we found. We've been through the overview. Let's look in a bit detail because questions arise and let's look at some of the relationships that we can see along the way. There are some important relationships and what we can see from this is important. The first one is sessions to conversions. Basically your sessions will follow your conversion rate, both up and down. He's got a pretty good conversion rate. He's got a twenty-five percent conversion rate in relation to the blue product, which is driving a lot of the growth.
The thing to note here is all these products are on the first page of his main keyword term. They're not, however, in the first two or there so if he got to that point there could be other ... A bit higher, as well. These products, he's not at the lower end of the price range. There is some products where he is probably double the price of the lowest price competitor but he's still on the first page of each one. Your conversion rate is your most important number. It's what we call "forward looking KPI".
By looking in Facebook and other things like that, you'll see people complaining about, there was one the other day, their sales are falling and they don't know why. Look back into it and it's basically their conversion rate's been falling and their sessions have been following with it. They've gone from quite small changes to quite drastic changes as it goes on. These things, we'll deal with how these work in the multipliers. We'll look at it a bit further. Basically, if you've got a higher converting product then Amazon will start to rank you, make you better. If your conversion rate is better than your competitors, then Amazon optimizes the traffic to your listing. They'll place your product higher in the listing. They'll place your product on other competitor's product pages, "People also bought:" or "You may be interested in:".
The good thing about Amazon businesses is that you don't have to optimize the traffic. Amazon's doing that for you. If you're having an e-commerce store, then you've got to do all this optimization of traffic yourself. Some of you may have e-commerce stores and you've got all this traffic coming to your site, then you're going to be putting the best-selling products on the front page but that requires work to do that. Amazon's already doing that for you.
From what I understand of the product search algorithm that Amazon have is, first, they find all the products that fit best into that search term and that's your backend keywords, the keywords you're using in your title, whether or not they use them in your bullet points, et cetera. They'll get all the products that they believe fit into that best fit for that search term and then they'll rank those products that return the best margin to Amazon. They'll have an algorithm or a formula that basically is very similar and it's very similar to a lot of other businesses. It's a gross margin return per session.
Within that, it's obviously ... They want to put the products that will most likely convert, people that haven't bought within three minutes or whatever the period is or added it to the cart within that period, then they know that they're going to lose them. They want to put the most likely products that are going to convert and earn them a commission plus their FBA fee, et cetera. Within that, there is also, within that ranking algorithm, there will also be a sales history but what we're seeing is, say you've got a promotion on, giving away products, you've got a high conversion rate because of that, Amazon will give you the benefit of the doubt to see whether your product sticks with these free conversions and, obviously, high conversions with the free giveaways, et cetera. Then they'll start to drop off if, organically, they can't generate their own level of sales. The best-selling products and the ones that have the growth, and we'll see this a bit later when we have a look at some of these figures, is those with the best conversion rates.
Let's look at the green product. Again, it's on the first page and there's some interesting graphs in this. We can see this is the pricing conversion rate graph and you can see it started in September. If we look at it, there's a gap here so he's testing prices. We've got prices dropped here and the conversion rate's gone up. We'll look at what that meant later. Then he's increased his price slowly and we've got this conversion. It's interesting to tell and we'll look at another product where he's got these ... It's something you need to look at on a regular basis to see whether what the relationship between pricing conversions is for your business, for your products. In some cases, you might see that, as your price increases, your conversion rate goes up because of perceptions of quality, et cetera. We're looking at, now, a conversion rate, it's about eighteen percent on the conversion rate. He's kind of mucking about with the prices a bit there but it tends to stabilize a bit.
Let's look at the blue product. Again, this is on the first page and we're seeing and interesting correlation between the conversion rate and price. Through here, we're seeing when the price was higher he was actually getting a better conversion rate. We've also go the question of, what is the volume on there? We're not seeing this inverse relationship too much on this product. This product is basically double the cheapest product on there. The cheapest product is ranked a bit higher. This is on the first page. He's still getting a twenty-five percent conversion rate. He's not in the top five but fairly close. Again, I mentioned before, within any product, any niche, there appears to be two segments and the high price segment will make ten times more money than the low price segment and, quite often, will have similar volumes as the lowest price.
Let's look at the benefit of hindsight. Could we have made different decisions along the way? It's always good, the benefit of hindsight makes it easy. What can we learn from these figures? Let's look at something, firstly, that went really well. Christmas bonus, this is the green product. It basically started in September, now October. By November, we've got six thousand dollars in sales. In December, it jumps to basically twenty-nine thousand in sales so massive jump in sales, a $23,000 increase. Drops back again after the ... This is not a Christmas product. It's not something like Christmas tree decorations or something like this.
Let's look at the four factors that made this a massive month. First, we ended up with this double bonus along the way. We ended up with conversions increasing from 20% to 29% so we've got a 45% increase in conversions. We also ended up with a massive jump in sessions, so this number of people visiting his page, from a 1000 in October to 2000 in November to 4000 in December. Between November and December, we got, basically, 100% increase. We doubled the sessions in December. In November we've gone from 2000 sessions with a 20% conversion rate, which equals 400 units. We'll go to this. In December, he's gone 4000 sessions with a 29% conversion rate. If we add those two together, we'll have a 20% in conversions and a 29% increase in sessions. It's 49%. It actually led to 1060 units so 190% increase in the number of units sold. We ended up with this double bonus.
There was another bonus in relation to this and as the conversion rate increased and he was always testing price, he started putting up the price over Christmas. It's something to remember, that if your conversion rate is over 20%, you should be testing whether it should be increasing the price, as well, just to test where that particular market is. We ended up with the price going from basically around $17.50 to $25, which is a 42% increase in price. Fantastic thing there. We end up with 190% increase in the number of units and a 42% increase in price which led to a 380% increase in sales.
Sales went from $6,000 to $29,000. In fact, it multiplies again because we got a 380% increase so the profit went from, basically, $2,500 in November to $17,500 in December. We've a $15,000 increase in profits, 600%. The gross profit rate increased from 43% to 60% in that period. By looking at these numbers and understanding where things were going, he's got his Christmas bonus. This is a massive increase in the level of profit of his business. One way to look at it is he's made more in that one month than the whole year put together.
We look at the sessions increased by a 100%. Conversion rate increased by 45%. The price increased by 42%. Gross profit rate increased by 40%. Add it all together and you'd say, "Okay, well that's a 227% increase," but it resulted in a 600% increase in profits. These type of numbers are really what you should be looking all the time. I've given another webinar in just how these multipliers work around and, just by small increases in each of these multipliers, you can have a massive impact on your bottom line. The successful businesses are looking out for always increasing these figures and making sure that if they're increasing one, they're not taking it away by decreasing another. For Amazon businesses, you really need to be looking at that conversion rate. It's just so important because what happens is you increase your conversion rate and the sessions will start to follow.
Let's look at another issue that appears to happen on the way. We're looking at January. We've had this exceptional month in December and then in January the sales have fallen back to $2,500, so from $30,000 down to $2,500. If we remember, it's kind of painful. You're seeing potentially this great product that you've got all disappearing at once. Just remember sales is a function of three factors: sessions, conversion rate and price. Over that time, he's boosted his price to $25 and then brought it back to $15 after the Christmas period. The reason for the decrease wasn't necessarily his conversion rate or the price or anything else. Just the number of sessions dropped for this product, the number of people visiting the pages. I don't believe anything really happened to the product itself and its ranking. Just less people wanted that product in January.
The principal reason, we have got a decrease in conversions there, but the principal reason appears to be just sessions have fallen, more than anything else. There seems to be a bit of a delayed reaction here in that the sessions have fallen. He's looked at what's happened and he's dropped his price again. The reason probably wasn't his price issue as the major factor but it's a bit of panic along the way. The principal reason was post-Christmas falling in sessions. We can see that there is a difference here. We had picked up a bit of ... There is a conversion rate boost, so he's dropped his price down to basically$12,000 and we have got a bump in the conversion rate long the way. That's kind of continued but he's bumped that up.
The important thing to consider here is the gross profit. Basically, we're looking at this low level of profits in January but that's primarily due to the fall in number of sessions and we've got, even though his conversion rate's gone up, we've only made $1,000 on that month, which is pretty poor. He's then increased his price over the next few months to maintain his gross profit level. We're looking at that continue along the way. There's an issue here, of course, in terms of his pricing but he's kind of always testing where that is.
Let's look at the future and what we could see in relation to this business and what issues we've got. The first one is we've got this declining conversion rate in relation to the red product, which is obviously concerning and he did identify that it was some quality control issues, which he's now addressed. The conversion rate on red seems to be improving. That red product is getting down to the danger zone where it will just start falling away in terms of traffic. The green product seems to be fairly stable, sitting about 17% - 18% and the blue product is a very good 25%. With the sessions, we've got this great trend. Remember, sessions are increasing by 14%.
We've got blue increasing at a great level. There's nothing wrong there. We've got the drop in sessions there due to they ran out of stock. Green's kind of holding its own a bit and red's obviously falling away. We just looked at this, we can look at it and say, "Okay, he's got an 18% conversion rate and the sessions are kind of stable. They're kind of moving around a bit. At 25% conversion rate, his sessions are increasing and at 13%, the sessions are falling." What it's meaning is that if you've got a product that is in the 20 to 25% conversion rate, Amazon's going to start sending you all the traffic.
Remember, Amazon is growing anywhere between 25% to 50% per annum so it's continuing to grow and if we just look at this, it'd be interesting to see if we're seeing other numbers in relation to this. I know some of our clients with very high conversion rates are seeing great benefits along the way. Their traffic just keeps on growing. It'll be interesting to see at what point you're getting the stable conversions or where you're getting this decline in conversions. If you've got conversion rates that are low, under 10, you're going to find it problematic in terms of everything else. Just remember, it just means someone with a 20% conversion rate compared to someone with a 10% conversion rate, their advertising is going to be half the price. They're at a significant advantage with that so you should always be kind of concentrating on improving your conversion rate.
If we look at the pricing issue here, the pricing going forward, he's starting to drop back a bit on prices but he's kind of testing where that market is. Probably a question of whether it needs to start competing but he does bounce that around. I would be concerned if those prices continued to have a declining trend. Before we dealt with the Christmas one where it was this multiplier effect of increasing sessions, increasing conversion rate, increasing prices, increases gross profit leads to an exponential growth, it also works in reverse. You don't want to be in the position where you've got all these multipliers decreasing. The first month it might not be too big but it starts getting exponentially bigger and you can see your business disappear quite quickly. Sales, we can see the combination there. A decline in gross profits, he's knocked off his price to a decline in sessions and we've got this declining price that's kind of showing up through there. The blue product, obviously going very well. We're seeing an increasing trend there, other than the May period.
The other issue is we've got this high reliance on the blue product. He's got a high degree of reliance on one product for basically most of his profits, which becomes concerning in terms of you running a business and looking at having everything reliant on one thing. If you're looking at all on Amazon, you're all dependent on Amazon and one product into Amazon. He's actually gone out and looked at other products along the way. This declining red has been addressed and that's been fixed up by improving the conversion rate, getting a better product, getting some better reviews in there as well as the blue product's just going well. There are always going to be challenges along the way.
What can we learn from this? Your conversion rate's your most important number. I can't say that enough. Everything derives from it. He removed the unprofitable product. It was kind of the orange product. It started off at 4%. It never got any good. The product was starting to be discounted, lowering gross profit. It was limiting his ability to grow and generate cash flow. The average gross profit at the moment is 33%. It's showing a declining trend which would start to affect his cash flow and his ability to keep growing, especially with the growth showing at 10% a month in sales. When you're looking at declining sales, I saw someone come up with this in relation to why their sales were falling, it's always a function of sessions, conversion rate and price. It's just a question of where the problem is. It will usually be in either sessions or conversion rate. It's one of the first things we go to. If you're looking at why your sales are bad or what you should do, it's just is it sessions or is it a conversion rate issue? Because Amazon takes care of the traffic, if you're running an e-commerce store, you've usually got either of two problems. You've got a conversion rate issue or a traffic problem but Amazon's got mountains of traffic. For Amazon businesses it becomes a conversion rate issue.
We've talked a bit about past KPI’s so there are things that are looking in the past, what's happened up till now. A past KPI is sales. That's where what sales we got last month. If you're looking at what's happening, where your business is going, you start looking at the forward KPI’s and that's going to be the trend in sessions and conversion rates. The reason if you look at sales just in itself, you're looking at the ... You don't know whether it's a sessions or a conversion rate issue. I remember one of our clients very similarly and their sessions were slightly decreasing, showing a declining trend. Not much but they had an increasing conversion rate. Their sales hadn't actually changed but it was a reason for concern is, "These sessions are starting to drop off. What's the reason for that?"